18.02.2026, 09:52 Uhr
Die Privatbank EFG International hat den Gewinn 2025 trotz diverser Sonderposten weiter gesteigert und damit die Höchstmarke des Vorjahres noch einmal überboten. Gleichzeitig kann das Zürcher Institut einen...


Investors have begun to expect a surge in shares in the run-up to Christmas. For research purposes, Schroders has taken a look at the data and has found an interesting result: December has the most frequent stockmarket rises.
Stock markets have risen in 79% of Decembers over the last three decades adding some substance to the myth of the "Santa Rally", Schroders research has found. "The 'Santa Rally' is a supposed effect of the Christmas feel-good factor, helping stock markets rise at the end of the year, although many seasoned investors remain unconvinced", he says. It is unwise to draw firm conclusions from stock market history but in the spirit of festive fun, Schroders analyses the data each year.
December best month for stock rises
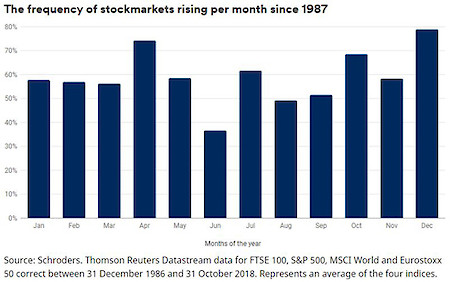
According to the reserach, Santa's rally certainly existed in Britain last year: the FTSE 100 rose by 4.9%. But elsewhere it was less apparent: The S&P 500 rose by only 1.0% and the MSCI World index edged up by 1.3%. The longer-term picture reflects a pattern. Schroder's analysis found global stock markets, as measured by the MSCI World index, have risen in 79% of Decembers since 1987, making it the best month of the year for stocks on average over the last 32 years. April was next best with stock markets rising 74.3% of the time followed by October, at 68.6%. June was the worst month with markets rising around a third of the time (36.7%).
It has not just been about the frequency of rises in December, but also the size of the gains. Global stock markets have risen by an average of 2.1% in December, since 1987. It is the highest average gain of any month, says the study. August has been the worst month, with the stock market index falling by an average of 1%. To underline this, Schroders analysed the performance of four stock market indices: FTSE 100, S&P 500, MSCI World and Eurostoxx 50 between 31 December 1986 and 31 October 2018. The chart below combines data of those major equities indices to show the frequency with which they rose in each month since 1987.

October a month of volatility
According to the study, the data for the month of October seems to underline the point on the unpredictability of markets. October has the third highest frequency of gains and the joint third highest average rise. But historically it is also the month that has included some of the biggest stock market falls. On 19 October 1987 global stock markets crashed amid worries about a slowing global economy and high stock valuations. The concerns were compounded by a computer glitch. Global stocks fell on average by 23% in October that year. The Asian financial crisis began in the summer of 1997. A sequence of currency devaluations in Asia rocked global confidence. Global stocks fell by 6.6% in October that year.
The seeds of the global financial crisis were sown when the US housing market began to collapse in 2007. The full extent was not realised until Lehman Brothers investment bank collapsed in September 2008. The global financial system seized up and a month later global stocks had fallen by more than 15%. Investors fretted about issues such as US-China trade tensions, European political uncertainty and the withdrawal of quantitative easing stimulus programmes. Global stocks fell 7.4% in October. It was the worst monthly performance for stocks globally in six years and it was the tenth worst in the last decade.
Positive mood and portfolio re-balancing the reasons
There is much speculation as to the reasons for the "December effect". One theory is based around investor psychology. There is, perhaps, more goodwill cheer in the markets due to the holiday season putting investors in a positive mood, which drives more buying than selling. Another view is that fund managers, which account for a substantial part of share ownership, are re-balancing portfolios ahead of the year-end.